
The Ultimate Guide to Report Types: Deluxe Report Types
- Part 1: How do Report Types Work?
- Part 3: 7 Query Scenarios
- Part 4: How to Position and Transition
- Part 5: Advanced Considerations
Imagine if you had a single custom report type per object that could address a majority of the requests you have to create a report using data from that object. This is similar to the concept of “one trigger per object” – you create one custom report type per object that you want to report on. In this custom report type, there are no object relationships enforced – gasp! You simply select the primary object and click save. The primary object you select will have its records represented by rows in your report results.
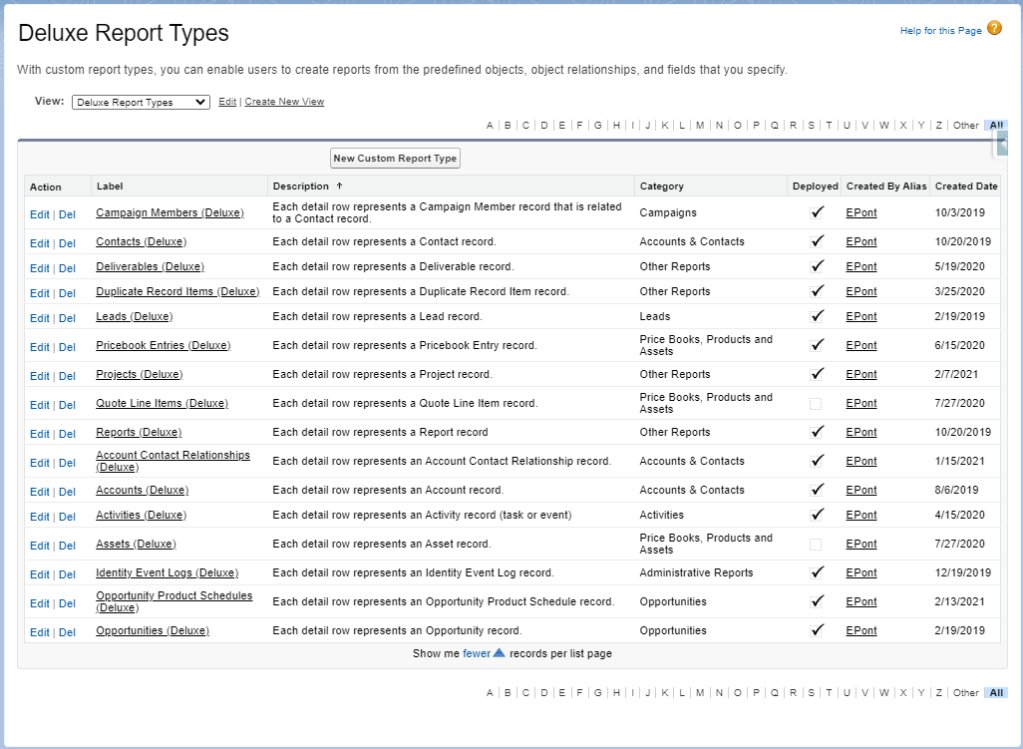
How can something so simple be so powerful? Let’s start from the top and create one of these deluxe report types to find out. You’ll need both the “Create and Customize Reports” and “Manage Custom Report Types” permissions to accomplish this in the setup menu. Search for “Report Types” in setup, click on that option, then click “New Custom Report Type”. Then you will choose the primary object. When viewing the tabular format of the results for this report type, what kind of records are being listed? Are they accounts? Contacts? Opportunities? You decide. Then give your custom report type a name. A naming convention I’ve employed is [the name of the primary object] followed by “Deluxe” in parenthesis: “Accounts (Deluxe)” or “Contacts (Deluxe)” or “Opportunities (Deluxe)”. This distinguishes the report type as being the one to rely on when reporting on records from that object and allows you to type in “Deluxe” when searching your available report types. In the description, write exactly what the results will show: “Each detail row represents a [primary object] record”. Here’s an example of what we’ve got so far for an “Opportunities (Deluxe)” custom report type:

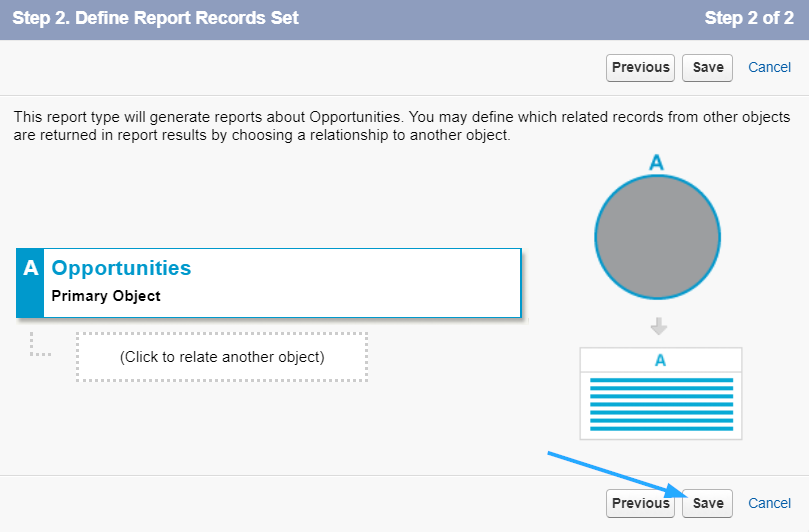
On the next screen, you’ll see options for Object Relationships. In a deluxe report type, only the primary object is defined and enforced in the object relationships, which you’ve already done on the first screen. Simply click “Save” to finalize your new custom report type.
Now is the fun part! With the proper data architecture in place, you will be able to traverse all the relationship fields you have defined on the primary object you chose in order to reference any field from the parent object, grandparent object, great-grandparent object, and great-great-grandparent object as report filters and/or report columns. That’s right, you can include fields from a 5-object hierarchy using this method. But it doesn’t end there – you can traverse multiple hierarchies starting from your primary object. This allows you to move up through your data architecture in as many ways as you need, referencing up to 1000 fields from up to 60 unique objects along the way. All of this is possible by editing the layout for the custom report type you just created. This is not currently part of the wizard you just stepped through, but it’s available for manipulation at the bottom of the screen. Click “Edit Layout” within the “Fields Available for Reports” section.

Here you will see all the fields from your primary object included in the default layout. If you ever create any new fields on your primary object in the future, you can add them to the layout by finding them in the panel on the right and dragging them over. Page through those screens to find more fields, which are listed alphabetically.

New since Winter ’21: You can select the “Auto add to custom report type” option when creating a new field in order to add the field to existing custom report types that specify the object in its Object Relationships.
Just above that panel is the “Add fields related via lookup” hyperlink. Clicking on this will show you a list of all the relationships that exist on the primary object you selected – these are the lookup and master-detail fields on that object. You can click to traverse one of these relationships, and you will find yourself on the parent object.
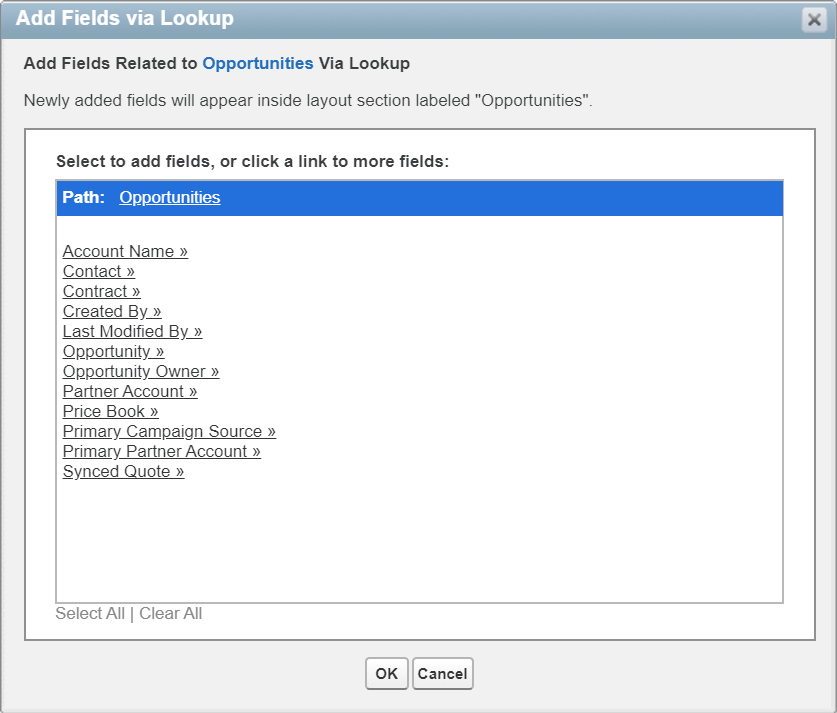
Here you can check off any of the fields that exist on that object and add them to your report type layout. Be sure to only select the fields you need! You might be tempted to click “Select All”, but some of your objects likely have many fields defined that aren’t actually helpful in reports. Some may not be used by your organization. They could be standard fields or something from an installed package that’s not being utilized. Some fields might not have any data in them. Take the time to only include fields that will bring value to those running reports using this report type – the fields with rich, relevant, reliable data. The “1000 field limit” can easily be avoided by carefully curating which fields are included in this layout. Once you have selected what you need from that object, click “OK”.

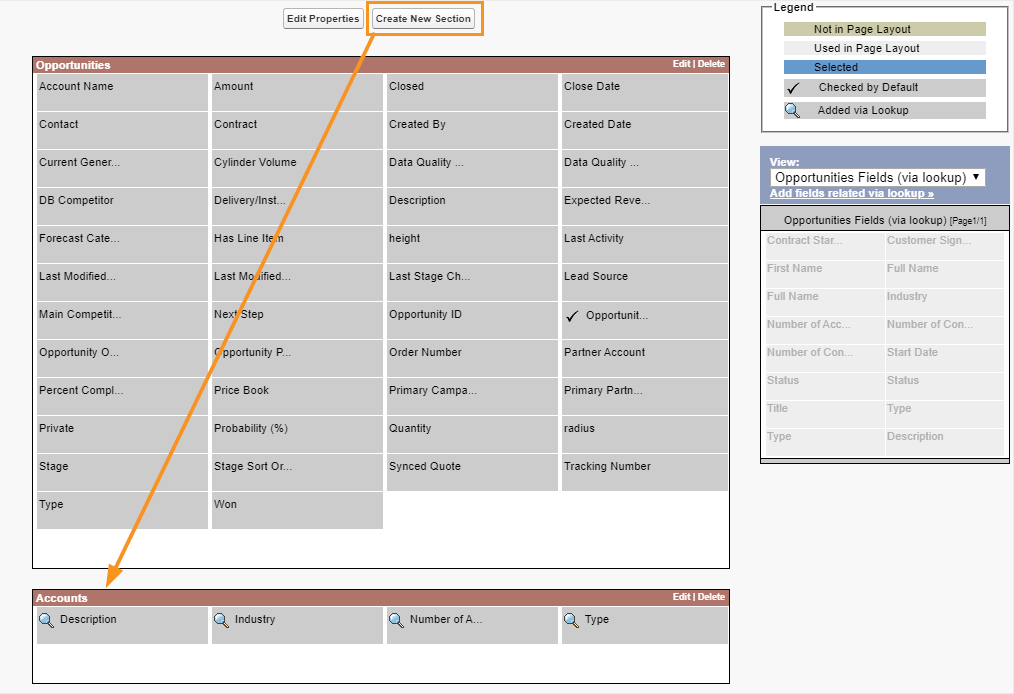
These fields will show up in the layout with a magnifying glass next to them – the “lookup” icon. This lets you know you are referencing a field from a parent object. I recommend creating a new section in your layout for each new object’s fields that you add to the layout – this helps to keep things organized as the fields will be rendered as folder groupings in the report builder user interface. You have full control to name those sections/folder groupings whatever you’d like. I tend to give some indication of what relationships are being traversed as I work further upward in the data architecture hierarchy.
Once that’s set, you can hop back into that “Add fields related via lookup” screen and traverse another relationship. If you follow the relationship to the object from earlier, you can then traverse its relationship fields in order to access fields from a grandparent object. There’s a breadcrumb-trail-style navigation indicator at the top of the screen to help you understand how far you’ve gone and get you back to an earlier screen if needed. You can click on four relationship fields in a row, which allows you to include fields from a five-object hierarchy (including the primary object). Starting back on the primary object, you can then traverse up a totally different relationship path. You can even split off to another branch after following the same relationships from a previous journey. This is only limited by the data architecture you have in place, and the 60 unique object limitation for custom report types.
Once all of your desired fields are added to the layout and organized into the relevant sections, you can change the display value for these fields. Double-click on any field to see this “Display as” option. You can even select multiple fields using ctrl+click (cmd+click on Mac) or shift+click and open up the edit screen for all of them at once – either by double-clicking one of the selected fields or clicking the “Edit Properties” button at the top. This is a great way to shorten up the default naming scheme – which is absolutely essential if you have traversed a handful of relationships to reference a field. You can even change the display value of a field completely and it will only affect how this field is displayed on reports using this custom report type. Your field’s API name and label are unaffected.
If you’d like to bulk update the “Display as” values for an entire section of fields, you can install the Search and Replace Google Chrome extension. When you open the Field Information modal window, right-click on it and select “Show as tab”. Then you can open the Search and Replace Google Chrome extension, ensure that the “Input fields only?” option is selected and all other options are deselected, and replace the desired text for all the fields at once.
The other option you’ll notice here is the “Checked by Default” checkbox. This allows you to create a report template for brand new reports that are created using this report type. Any of the fields that you have “checked by default” will appear as columns in a brand new report. They appear in the same order that they are listed in the report type layout. This is a great way to jump start your reports with those basic fields you will probably want to see as columns anyway.

This layout is looking great! One last thing to note before we click save – you know that time frame filter in the report builder? It uses the first date or date/time field listed in your report type layout as the field to filter on for the time frame. Double check to ensure there’s a useful field listed first to alleviate that frustration. Vote on this idea if you’d like to set the default time frame value – but not until after you click “Save” on this layout!
You can repeat this process for any other objects you want to report on in your organization. Remember, you only need one deluxe report type per object. Create a list view for “Deluxe Report Types” (filtering on the name) so you can easily find them all.
Stay tuned for part 3 where we dive into what this deluxe report type is capable of. Then part 4 will cover some tips for transitioning to this deluxe report type solution for all of your reporting needs. Finally, part 5 details some advanced considerations for deluxe report types.
Share your success story
If you implement deluxe report types in your organization, we’d love to hear your success story. Use #DeluxeReportType or #DeluxeReportTypes and mention @ReportForce on Twitter. Here’s a tweet template.
Categories
Evan Ponter View All
Evan Ponter is a Salesforce Admin Hero from Baltimore, MD who has been focusing on declarative development since 2012. His desire to keep an org simple, streamlined, and maintainable by future admins has led him to being an expert on the declarative features of the platform. A deep understanding of reports, the importance of proper data modeling, and the utilization of declarative automation tools have propelled Evan along a blossoming Salesforce journey where he solves complex problems using clever solutions that provide the ultimate flexibility. When he's not logged into Salesforce, Evan enjoys playing bass guitar in a local rock band.

Thanks for the excellent series Evan. I try to use Deluxe Report Types wherever possible, and it usually works great. I have a scenario that has me baffled, however. I need to join Contacts with Affiliated Organizations (this is an NPSP thing). My Report type uses “Contacts with or without related Organization Affiliations”. I then add some fields from the Contact’s Household Account via Lookup, and some fields from the affiliated Org Account via Lookup. After doing so, I lose my ability to use Cross Filters in a report using this report type (“Add Cross Filter” is lowlighted/not selectable in report builder). I’ve confirmed that if I create a new report type with the simple A-B object with/without relationship mentioned above, I CAN use cross filters. Any idea why I’d lose Cross Filters because of the added lookup fields?
LikeLike
Weird. I’m not able to recreate that issue in my NPSP org. I have some screenshots I’ll tweet to you. I created a custom report type that has “Contacts (A) with or without related records from Organization Affiliations (B)” specified for the object relationships. Then I edited the layout, left “Contact Fields” as the selection in the “View” dropdown in the right-side panel, and clicked “Add fields related via lookup”. I clicked on the standard “Account Name” relationship and selected a field from the Account object. After adding this to the layout, I chose “Organization Affiliation Fields” as the selection in the “View” dropdown in the right-side panel, and clicked “Add fields related via lookup”. I clicked on the standard “Organization” relationship (this may be labeled “Account” in your org) and selected a field from the Account object. Then I saved the layout.
I created a new report using this custom report type, added both fields (one Household Account field and one Affiliated Organization Account field) as columns, and was able to add a cross filter.
I believe I’ve noticed that cross-filtering ability won’t be enabled if your custom report type was created with different Object Relationship settings that were then altered to their current state. You have to create the custom report type with A and B objects set with the desired “with” / “with or without” relationship setting.
What are hoping to answer in this report, in non-technical terms? Maybe I can help brainstorm ideas with you.
LikeLike