
Home
A Learning Hub for Salesforce
Reports, Dashboards & Analytics

-
 Featured
Spring ’26 Release Report and Dashboard Features 📊
With the upcoming Spring ’26 release we have a few new features for Reports and Dashboards. Let’s take a look at what we are getting.
-
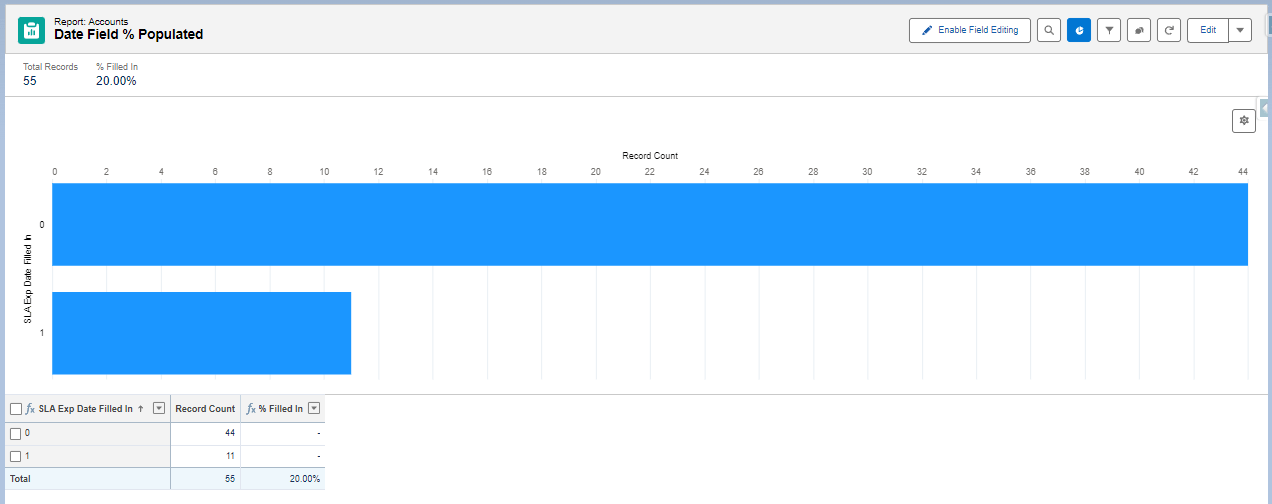
Report on Percentage of Records a Field is Populated
Understanding how consistently users populate key fields is one of the best indicators of data quality and adoption. Incomplete data can cripple dashboards, forecasts, and automation. Measuring the percentage of records with a value in a specific field gives admins and business leaders an actionable metric: how often users are doing what’s expected.
-

Can Salesforce Flows Support Reporting and Visualization?
Reporting is one of the strongest features of the Salesforce platform. With powerful standard tools like report builders and dashboards, you can analyze and visualize your data to make informed decisions. But even if you’re a reporting pro, you’ve probably hit limitations, especially when your data isn’t structured just right. That’s where Salesforce Flows come in.
Follow This Blog
Get new content delivered directly to your inbox.
