
Blocking “Export Reports” Isn’t Enough Anymore: What AI Connectors Mean for Data Export Controls
Discover the risks of relying on ‘Export Reports’ for data protection in Salesforce. Learn how AI tools may expose sensitive data.

Salesforce reports, dashboards, and analytics
Discover the risks of relying on ‘Export Reports’ for data protection in Salesforce. Learn how AI tools may expose sensitive data.
If you’re a Salesforce admin or architect right now, your inbox has been busy. Salesforce has been signaling for months that 2026 is the year enforcement stops being theoretical. Three distinct security requirements are now actively rolling out — and if you haven’t already built the reports to audit your org’s compliance against each one, this post is your starting point.
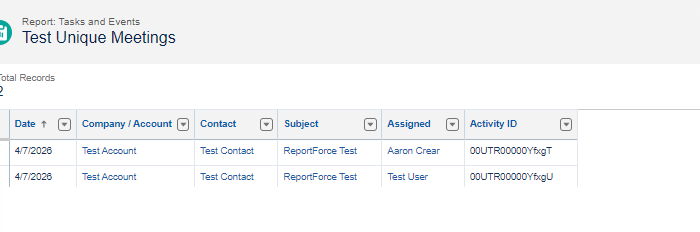
If you’re a sales manager trying to answer a simple question—“How many customer meetings did my team have this month?”—you might be getting the wrong answer without even realizing it. … Continue Reading Stop Inflated Meeting Metrics in Salesforce: A Simple Fix for Sales Managers
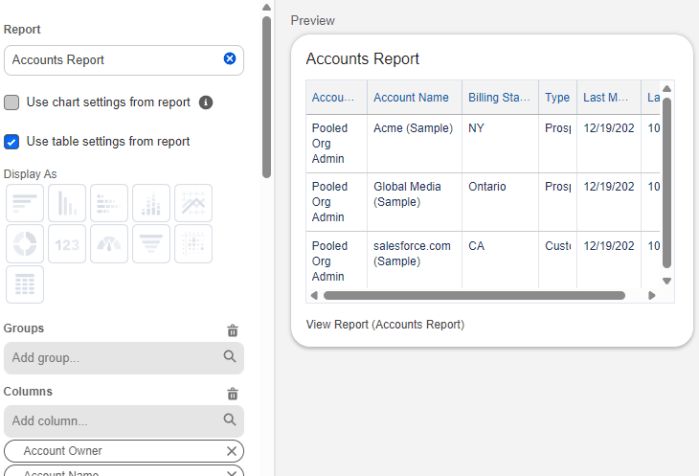
With the upcoming Spring ’26 release we have a few new features for Reports and Dashboards. Let’s take a look at what we are getting.
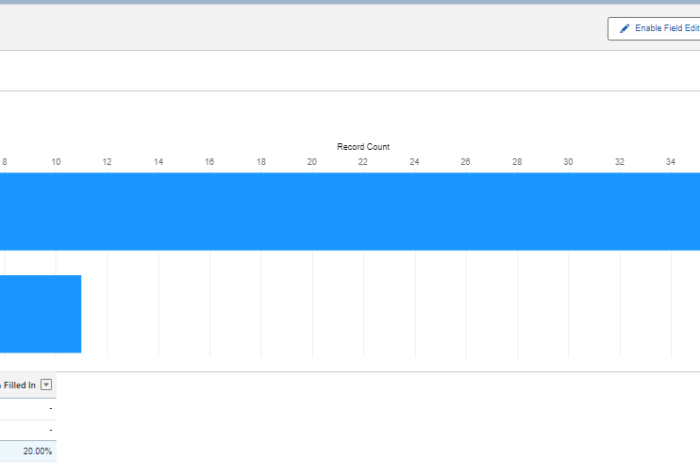
Understanding how consistently users populate key fields is one of the best indicators of data quality and adoption. Incomplete data can cripple dashboards, forecasts, and automation. Measuring the percentage of records with a value in a specific field gives admins and business leaders an actionable metric: how often users are doing what’s expected.
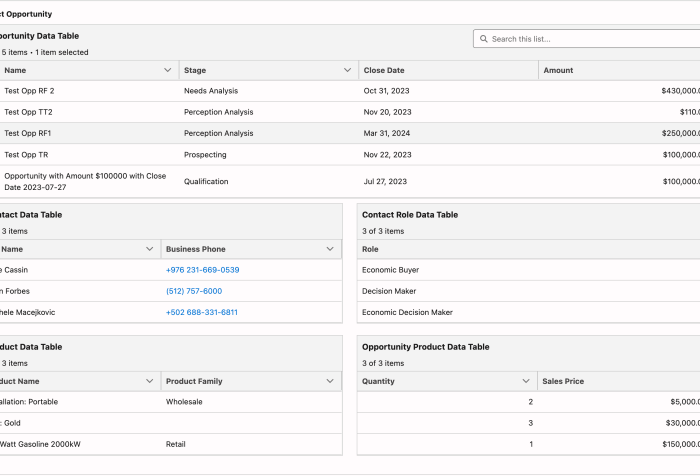
Reporting is one of the strongest features of the Salesforce platform. With powerful standard tools like report builders and dashboards, you can analyze and visualize your data to make informed decisions. But even if you’re a reporting pro, you’ve probably hit limitations, especially when your data isn’t structured just right. That’s where Salesforce Flows come in.

Salesforce CRM Analytics isn’t just for dashboards and lenses tucked away in Salesforce anymore. With the CRM Analytics for Slack app, users can bring powerful analytics insights right into their Slack workspace—where collaboration happens in real time.
We will explore how users can view, share, and act on standard Salesforce Reports and Dashboards(no paid CRM Analytics Licenses required) without leaving Slack. Whether you’re a sales manager monitoring pipeline health or a service leader tracking case resolution times, CRM Analytics in Slack makes it easier than ever to stay informed and responsive.

Report on Salesforce Account Hierarchy

Show a cumulative comparison of sales by year and month to see where we are compared to this time last year.

We all know that Reports and Dashboards are critical to businesses. However, far too often we end up with hundreds of Reports, most of which go unused, piling up in folders that no one even remembers where to access them. Wouldn’t it be better if we could take our most important analytics and put them in the forefront ? Good news, we can, by embedding them in the UI. I’ll demo several ways to bring these charts to the surface and place them where they are truly useful and actionable.
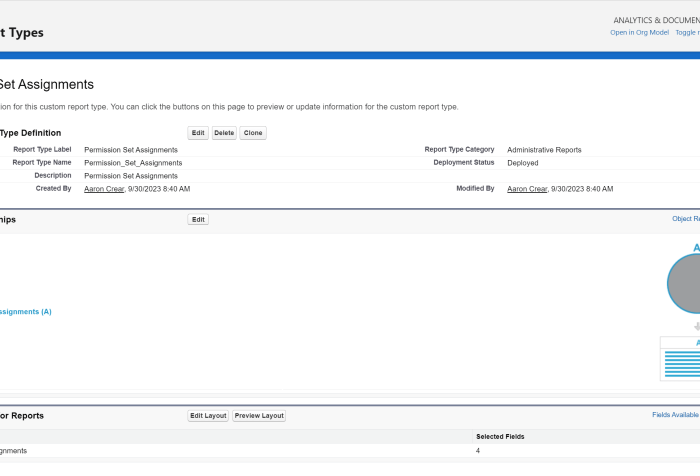
With the upcoming Winter ’24 release we are being given three new useful custom report types.
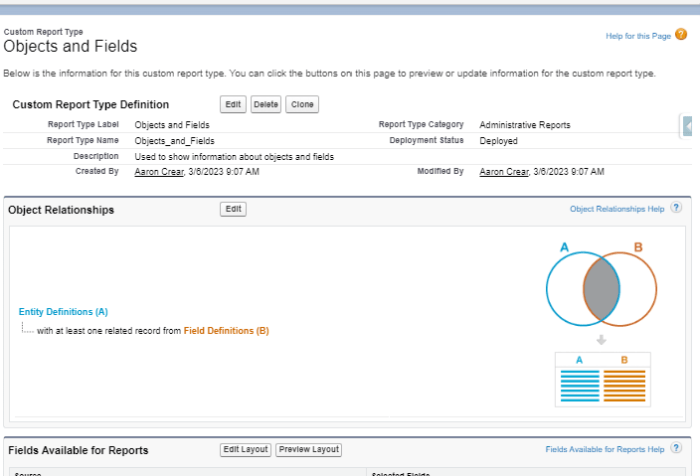
Monitoring and auditing object and field information can be a tedious Task. Going through Object Manager to an Object then clicking on Fields & Relationships and trying to scroll while waiting for the list to update takes a while (in cases where you can’t just search on field name). Wouldn’t it be great if we had a way to get information on our Objects and Fields quickly in one screen? Good news is, we can, with Reports.
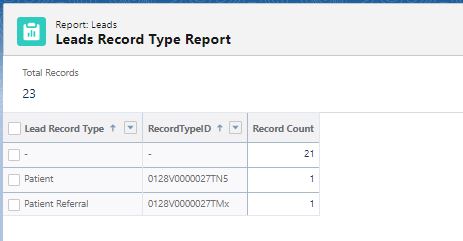
Use these two simple Salesforce reports to make your data loads faster.

Overcome polymorphic field limitations as cross object dashboard filters by owner. Learn how you can filter Opps and Leads by owner on a dashboard.
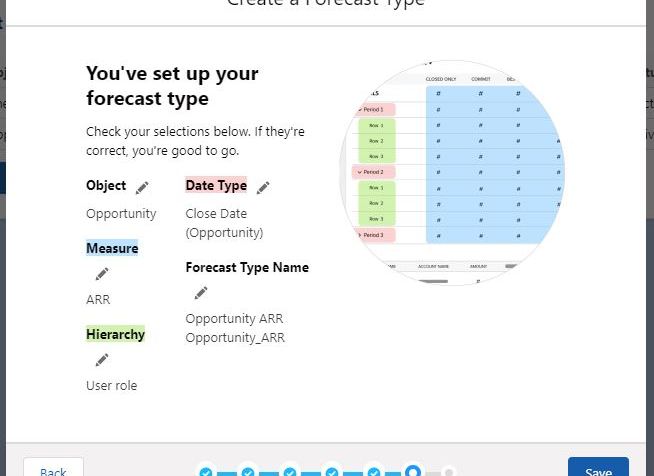
Accurate Forecasting is critical to all businesses. It allows for strategic planning, cash flow predictability and overall business guidance. One longstanding complaint has been the lack of flexibility to customize Forecasting. With the Summer ’21 release we now have the ability to create and report on Forecasts Types based on custom fields along with an improved experience to manage Forecast Types. Let’s take a look at the new capabilities.

There is no “dynamic” option available in the report builder that allows a report to use the currency specified for the running user. Until this is supported natively, you can follow one of these methods in order to edit the metadata of your report so that it displays the currency of the running user. This makes it possible to manage a single set of reports in multi-currency enabled orgs.

