
Count the Number of Date Groups in a Report Dynamically
Use Case
A report request comes in asking for a calculation showing the average number of records created in a week. The time frame for this report could be set to a few different values – like last year, last quarter, or over the course of the previous two years. Ideally, the calculation would be dynamic and count the number of weeks that are present in the report results so that these time frame adjustments can be made on the fly.
The Solution
You can set up a formula field on the object in question and then utilize a summary formula within a report in order to dynamically count the number of date groups shown on a report at run time. The concept behind the logic of the formula field on the object is the same no matter what date grouping granularity you are hoping to use: The formula should return a number representing where that date group would be positioned if compared to all other date groups of the same granularity. If you are interested in monthly groupings, February of any given year should always be positioned one place higher than January of that same year. February should be positioned 12 places higher than February of the previous year. If you are interested in quarterly groupings, Q3 of any given year should always be positioned one place higher than Q2 of that same year. Q3 should be positioned 4 places higher than Q3 of the previous year. The same concept applies for years, weeks, days, etc.
Then, for the summary formula in the report, you will utilize a MAX function on this formula field and subtract the result of applying the MIN function to this same formula field. This gives you the difference between the highest sequenced value and the lowest sequenced value present in your report results. Add 1 to this result in order to make the calculation inclusive of the first and last date groups. Let’s dive into the specifics on both pieces of this solution so you can implement it in your org for your use case.
Create a formula field on the object
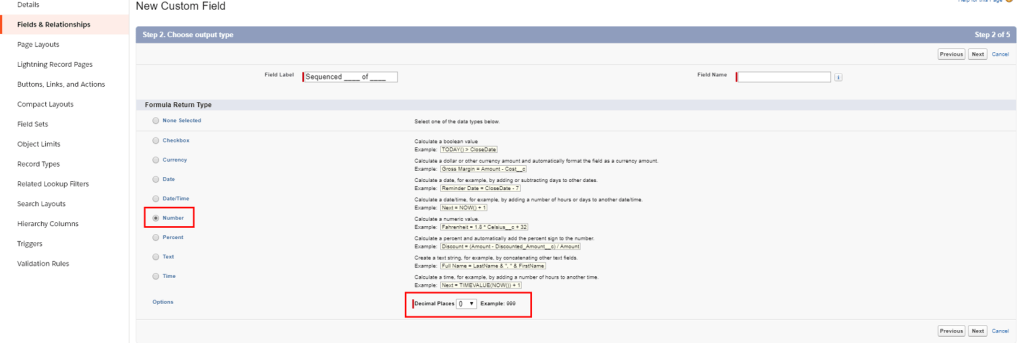
First, create a formula field on the object that has the date or date/time field in question. Select the “number” data type and enter “0” for the decimal places. For the use case mentioned at the beginning of this article, I would name this field “Sequenced Week of Created Date“. Adjust the naming convention to match the date grouping granularity and the date or date/time field used in your scenario.

Next, you will paste in the formula of your choosing. Below are all the common variations of this logic for various date granularity. Be sure to replace the placeholders with the API names for your fields.
If you are using a date/time field, you will need to wrap that field in a DATEVALUE() function so that it returns a date value for any of the functions requiring a date. For example, using the CreatedDate field, you would replace “date_field_API_name” with “DATEVALUE(CreatedDate)”. You may want to consider enabling the Improve DATEVALUE() accuracy for DST setting for your org so that the correct date is returned for times within one hour of midnight.
Calendar Year Logic
IF(!ISBLANK(date_field_API_name),
    YEAR(date_field_API_name),
/*ELSE*/
    NULL
)
Fiscal Year Logic (based on ending month)
This result will align to your fiscal year (in number format) if you number your fiscal years based on the ending month. I recommend storing your fiscal year start month and fiscal year start day in custom settings or a custom metadata type record (using the “number” data type for those fields) so you don’t hardcode those values here. A fiscal year starting July 1st would use 7 for fiscal year start month and 1 for fiscal year start day. A fiscal year starting July 15th would use 7 for fiscal year start month and 15 for fiscal year start day.
IF(!ISBLANK(date_field_API_name),
    YEAR(date_field_API_name)
    +
    IF(
        MONTH(date_field_API_name) > Fiscal_Year_Start_Month
        ||
        (
            MONTH(date_field_API_name) = Fiscal_Year_Start_Month
            &&
            DAY(date_field_API_name) >= Fiscal_Year_Start_Day
        ),
        1,
    /*ELSE*/
        0
    ),
/*ELSE*/
    NULL
)
Fiscal Year Logic (based on starting month)
This result will align to your fiscal year (in number format) if you number your fiscal years based on the starting month. I recommend storing your fiscal year start month and fiscal year start day in custom settings or a custom metadata type record (using the “number” data type for those fields) so you don’t hardcode those values here. A fiscal year starting July 1st would use 7 for fiscal year start month and 1 for fiscal year start day. A fiscal year starting July 15th would use 7 for fiscal year start month and 15 for fiscal year start day.
IF(!ISBLANK(date_field_API_name),
    YEAR(date_field_API_name)
    -
    IF(
        MONTH(date_field_API_name) > Fiscal_Year_Start_Month
        ||
        (
            MONTH(date_field_API_name) = Fiscal_Year_Start_Month
            &&
            DAY(date_field_API_name) >= Fiscal_Year_Start_Day
        ),
        0,
    /*ELSE*/
        1
    ),
/*ELSE*/
    NULL
)
Calendar Quarter Logic
This works for fiscal quarters too as long as each fiscal quarter starts on Jan 1, Apr 1, Jul 1, or Oct 1.
IF(!ISBLANK(date_field_API_name),
    CEILING(MONTH(date_field_API_name) / 3)
    +
    4 * YEAR(date_field_API_name),
/*ELSE*/
    NULL
)
Fiscal Quarter Logic
This logic is only necessary if one your fiscal quarters overlaps two different calendar years. First, implement a Sequenced Fiscal Year field using the relevant option above. That field’s API name should be used in place of “Sequenced_Fiscal_Year_field_API_name” in the formula below. This logic works as expected for any fiscal quarter that starts within the first 28 days of a calendar month and each fiscal quarter starts on the same day of the month. (If you have fiscal quarters starting on the 29th or later in a month, please leave a comment – I’d love to learn how your organization manages this). I recommend storing your fiscal year start month and fiscal year start day in custom settings or a custom metadata type record (using the “number” data type for those fields) so you don’t hardcode those values here. A fiscal year starting August 1st would use 8 for fiscal year start month and 1 for fiscal year start day. A fiscal year starting August 15th would use 8 for fiscal year start month and 15 for fiscal year start day.
IF(!ISBLANK(date_field_API_name),
    CEILING(
        (
            MOD(
                MONTH(date_field_API_name) + 12 - Fiscal_Year_Start_Month -
                IF(DAY(date_field_API_name) < Fiscal_Year_Start_Day,
                    1,
                /*ELSE*/
                    0
                ),
                12
            )
            +
            1
        )
        /
        3
    )
    +
    4 * Sequenced_Fiscal_Year_field_API_name,
/*ELSE*/
    NULL
)
Calendar Month Logic
This works for fiscal months too as long as each fiscal month starts on the 1st day of the calendar month.
IF(!ISBLANK(date_field_API_name),
    MONTH(date_field_API_name)
    +
    12 * YEAR(date_field_API_name),
/*ELSE*/
    NULL
)
Fiscal Month / Period Logic
This logic is only necessary if each of your fiscal months / periods overlap two different calendar months. First, implement a Sequenced Fiscal Year field using the relevant option above. That field’s API name should be used in place of “Sequenced_Fiscal_Year_field_API_name” in the formula below. This logic works as expected for any fiscal month / period that starts within the first 28 days of a calendar month and each fiscal month starts on the same day of the month. (If you have fiscal months / periods starting on the 29th or later in a month, please leave a comment – I’d love to learn how your organization manages this). I recommend storing your fiscal year start month and fiscal year start day in custom settings or a custom metadata type record (using the “number” data type for those fields) so you don’t hardcode those values here. A fiscal year starting September 15th would use 9 for fiscal year start month and 15 for fiscal year start day. A fiscal year starting October 5th would use 10 for fiscal year start month and 5 for fiscal year start day.
IF(!ISBLANK(date_field_API_name),
    (
        MOD(
            MONTH(date_field_API_name) + 12 - Fiscal_Year_Start_Month -
            IF(DAY(date_field_API_name) < Fiscal_Year_Start_Day,
                1,
            /*ELSE*/
                0
            ),
            12
        )
        +
        1
    )
    +
    12 * Sequenced_Fiscal_Year_field_API_name,
/*ELSE*/
    NULL
)
Sunday – Saturday Week Logic
IF(!ISBLANK(date_field_API_name),
    MFLOOR((date_field_API_name - DATE(1905,1,1)) / 7),
/*ELSE*/
    NULL
)
Monday – Sunday Week Logic
IF(!ISBLANK(date_field_API_name),
    MFLOOR((date_field_API_name - DATE(1905,1,2)) / 7),
/*ELSE*/
    NULL
)
Tuesday – Monday Week Logic
IF(!ISBLANK(date_field_API_name),
    MFLOOR((date_field_API_name - DATE(1905,1,3)) / 7),
/*ELSE*/
    NULL
)
Wednesday – Tuesday Week Logic
IF(!ISBLANK(date_field_API_name),
    MFLOOR((date_field_API_name - DATE(1905,1,4)) / 7),
/*ELSE*/
    NULL
)
Thursday – Wednesday Week Logic
IF(!ISBLANK(date_field_API_name),
    MFLOOR((date_field_API_name - DATE(1905,1,5)) / 7),
/*ELSE*/
    NULL
)
Friday – Thursday Week Logic
IF(!ISBLANK(date_field_API_name),
    MFLOOR((date_field_API_name - DATE(1905,1,6)) / 7),
/*ELSE*/
    NULL
)
Saturday – Friday Week Logic
IF(!ISBLANK(date_field_API_name),
    MFLOOR((date_field_API_name - DATE(1905,1,7)) / 7),
/*ELSE*/
    NULL
)
Day Logic (including Saturday and Sunday)
The relatively new Count Unique Values feature in Lightning Report Builder can be applied to a date field in a report in order to count the number of unique date values. This works great if you only want to count the dates that appear in your results. Once enabled, you can reference this unique count in a custom summary formula by selecting it from the fields pane. If you’d like to also include dates that don’t have any records, you can use the formula below in a custom formula on the object in question:
IF(!ISBLANK(date_field_API_name),
    date_field_API_name - DATE(1905,1,1),
/*ELSE*/
    NULL
)
Weekday Logic (excluding Saturday and Sunday)
IF(!ISBLANK(date_field_API_name) && WEEKDAY(date_field_API_name) > 1 && WEEKDAY(date_field_API_name) < 7,
    (MFLOOR((date_field_API_name - DATE(1905,1,1)) / 7) * 5)
    +
    WEEKDAY(date_field_API_name),
/*ELSE*/
    NULL
)
Create a summary formula in the report
Once the above formula field is created on the object, you can move to the report builder to create a summary formula within a report. If you are using a custom report type, be sure to include the new formula field in that report type. The basic logic to count the number of date groups in a summary formula within a report based on the formula field you created on the object above is:
YourObject.YourFormulaField:MAX
-
YourObject.YourFormulaField:MIN
+
1
This can be used as the denominator in a calculation used to show the average number of records for that date grouping:
RowCount
/
(
YourObject.YourFormulaField:MAX
-
YourObject.YourFormulaField:MIN
+
1
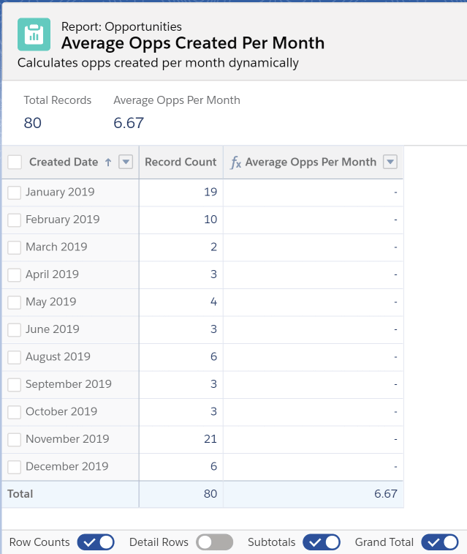
)If the custom formula field created on the opportunity object was set up with the logic to count the number of months based on the created date, the summary formula in the report (named “Average Opps Per Month”) would look like this:
RowCount
/
(
    Opportunity.Sequenced_Month_of_Created_Date__c:MAX
    -
    Opportunity.Sequenced_Month_of_Created_Date__c:MIN
    +
    1
)
Examples
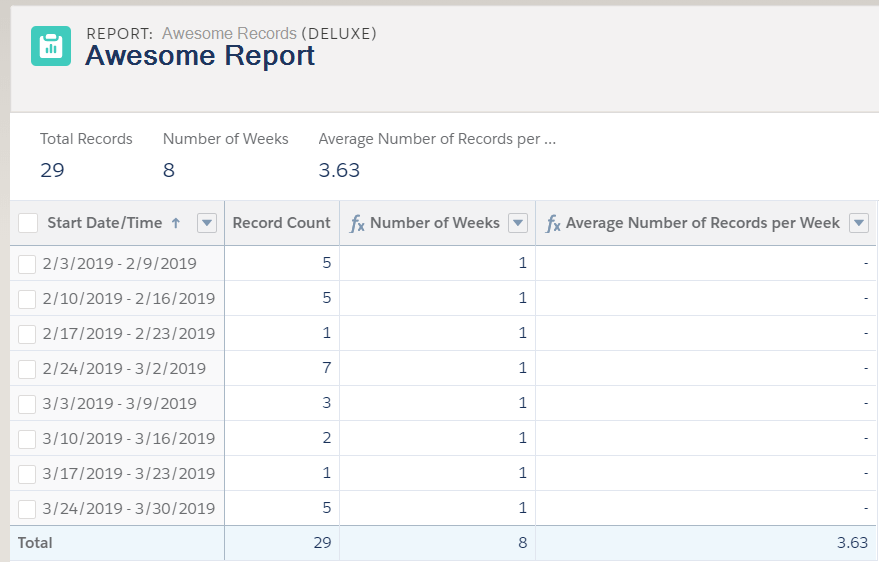
These examples use the Sunday – Saturday Week Logic for the custom formula field on the object. Then, the summary formula in the report calculates the number of records (RowCount) divided by the number of weeks shown in the report results.
What is the average number of records per week for the overall time frame specified in the report?
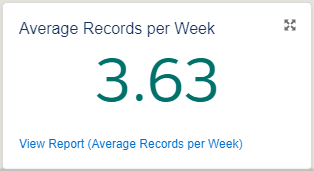
This result can be displayed within a metric component on a dashboard.
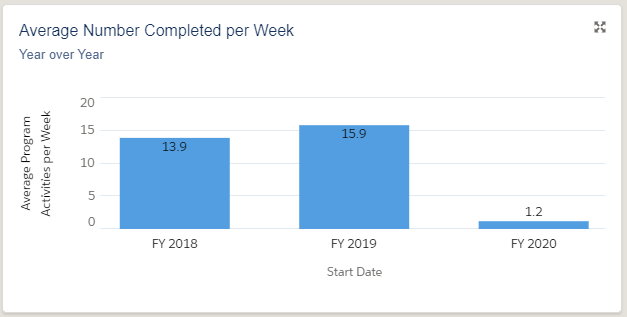
What is the average number of records per week for each of the last three fiscal years? Each group’s time frame should be based on its own data for each year.

The column grouping grand total data can be displayed on a bar chart on a dashboard to show the average number of records for each fiscal year.
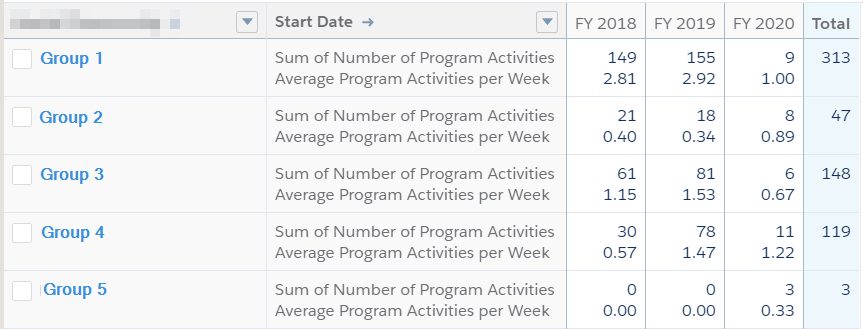
What is the average number of records per week for each of the last three fiscal years? Each group’s time frame should be based on the aggregated fiscal year data across all groups.
There have been 9 weeks in FY 2020 when this report was run. Group 1 had a record each week, their average per week is 1. Group 5 had a record in each of the first 3 weeks, but none after that. This calculation uses 3 as the numerator (the number of records for that group) and 9 as the denominator (which is taken from the row grand summary for that column) and results in 0.33. For the completed years, each group is getting an average calculated based on a 52-week year regardless of having records in any week of that year – as long as one of the groups has data in the first week of each year and one of the groups has data in the last week of each year.
Here’s the summary formula behind this calculation:
RowCount
/
(
    PARENTGROUPVAL(YourObjectHere.YourNewSequenceFieldHere:MAX, ROW_GRAND_SUMMARY, YourColumnGroupingFieldHere)
    -
    PARENTGROUPVAL(YourObjectHere.YourNewSequenceFieldHere:MIN, ROW_GRAND_SUMMARY, YourColumnGroupingFieldHere)
    +
    1
)
Considerations
This technique works great as long as there is data in both the highest and lowest date grouping. If you were to filter the time frame to a calendar year and there was no data present for December, the calculation would use the next highest date grouping as the MAX date, which would be 11 for the November data. Depending on your use case, this might be desirable.
If there is a date grouping in the middle of the time frame that has no data, that grouping is still counted. Imagine filtering a report to show records for calendar year 2019 and grouping by month. If there is data for each month except July 2019, the calculation for the number of months present in the report resolves to 12 since data exists in January 2019 (the minimum sequenced month value) and December 2019 (the maximum sequenced month value).
Generally, you will have better success with this technique in scenarios where there is data present in each date grouping of your report results. Please leave a comment with any questions, concerns, or suggestions for improvement. Thanks for reading and stay tuned for more reporting solutions.
Categories
Evan Ponter View All
Evan Ponter is a Salesforce Admin Hero from Baltimore, MD who has been focusing on declarative development since 2012. His desire to keep an org simple, streamlined, and maintainable by future admins has led him to being an expert on the declarative features of the platform. A deep understanding of reports, the importance of proper data modeling, and the utilization of declarative automation tools have propelled Evan along a blossoming Salesforce journey where he solves complex problems using clever solutions that provide the ultimate flexibility. When he's not logged into Salesforce, Evan enjoys playing bass guitar in a local rock band.

This is an insightful solution that I could definitely apply in my own work.
LikeLike
This formula is super helpful. Thanks!
LikeLike